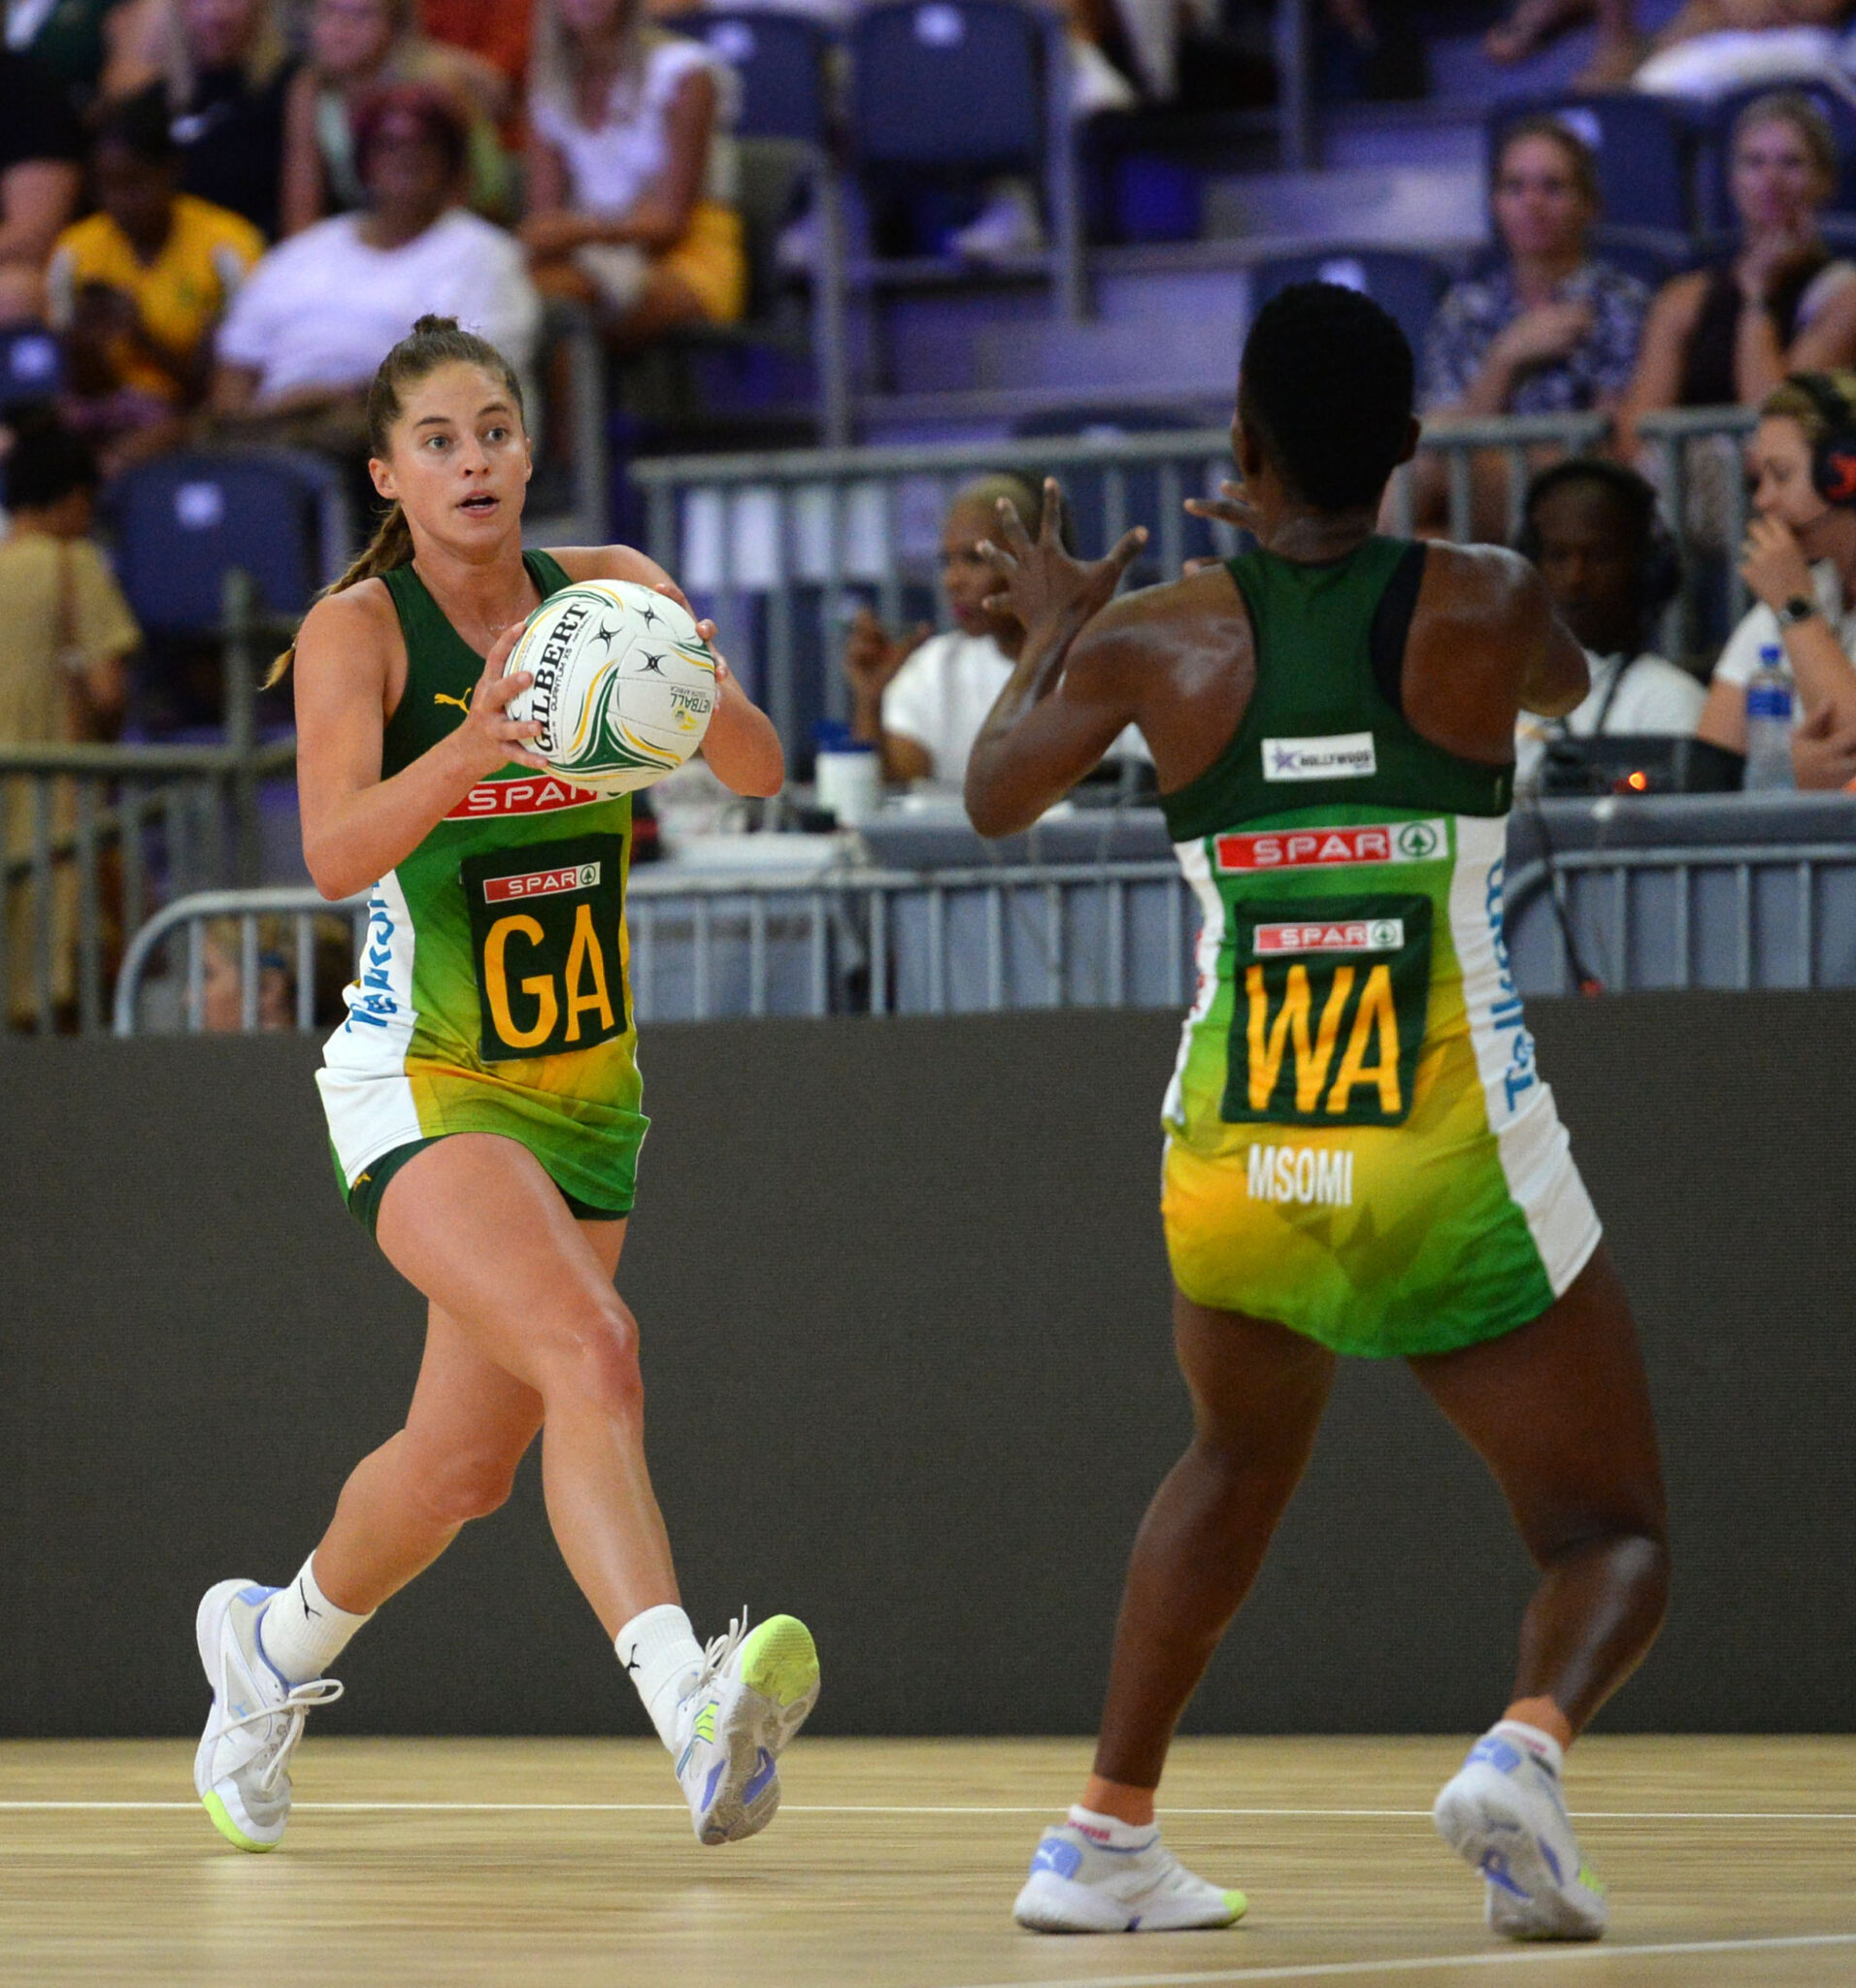
The Proteas are the hardest working ladies in Netball as confirmed by the World Netball rankings.
South Africa’s finest have played the most matches in the current rankings period which started on 1 July 2019.
ALSO READ: Proteas skipper bags personalised shoes from Puma
South Africa ranked fifth ahead of Netball World Cup
After the most recent update, South Africa’s Proteas find themselves fifth on the rankings despite having the most total points.
ALSO READ: SPAR Proteas’ Chawane is fearless ahead of Netball World Cup
Owing to World Netball’s average rankings system, the Proteas are fifth on the latest standings heading into a home World Cup.
At the last World Cup South Africa finished fourth but they ran Australia close in the semi-final before again coming up short in the third-place playoff.
ALSO READ: SPAR Proteas’ van der Merwe speaks unity in the team
However, Southern Africa continues to threaten to become a powerhouse in Netball with Malawi (6th), Zimbabwe (13th) and Zambia (16th) all ranked inside the top 20.
Also in the top ten is eighth-place Uganda which gives Africa three nations among that elite stratum tied with Europe (entirely represented by nations within the UK) and the Pacific region for the most representatives.
ALSO READ: Bongi Msomi headlines Netball SA’s final World Cup squad
Rankings
| RANKING | FLAG | TEAM | PLAYED | WEIGHTED | POINTS | RATING |
|---|---|---|---|---|---|---|
| 1 | Australia | 38 | 28 | 5,774 | 206 | |
| 2 | New Zealand | 46 | 33 | 6,514 | 197 | |
| 3 | England | 48 | 34 | 6,108 | 180 | |
| 4 | Jamaica | 40 | 31 | 5,485 | 177 | |
| 5 | South Africa | 65 | 43 | 6,770 | 157 | |
| 6 | Malawi | 56 | 40 | 5,079 | 127 | |
| 7 | Tonga | 21 | 20 | 2,510 | 126 | |
| 8 | Uganda | 49 | 33 | 3,941 | 119 | |
| 9 | Wales | 30 | 23 | 2,699 | 117 | |
| 10 | Scotland | 23 | 19 | 2,088 | 110 | |
| 11 | Trinidad & Tobago | 27 | 21 | 2,031 | 97 | |
| 12 | Northern Ireland | 27 | 19 | 1,668 | 88 | |
| 13 | Zimbabwe | 41 | 28 | 2,398 | 86 | |
| 14 | Barbados | 29 | 22 | 1,762 | 80 | |
| 15 | Sri Lanka | 14 | 11 | 817 | 74 | |
| 16 | Zambia | 31 | 22 | 1,619 | 74 | |
| 17 | Samoa | 28 | 23 | 1,652 | 72 | |
| 18 | St Vincent & Grenadines | 13 | 11 | 760 | 69 | |
| 19 | Fiji | 30 | 27 | 1,852 | 69 | |
| 20 | Cook Islands | 13 | 9 | 593 | 66 | |
| 21 | Grenada | 10 | 9 | 514 | 57 | |
| 22 | Philippines | 6 | 6 | 337 | 56 | |
| 23 | Namibia | 36 | 24 | 1,308 | 55 | |
| 24 | Botswana | 24 | 17 | 925 | 54 | |
| 25 | UAE | 14 | 12 | 620 | 52 | |
| 26 | Ireland | 33 | 27 | 1,057 | 39 | |
| 27 | Isle of Man | 27 | 21 | 763 | 36 | |
| 28 | Singapore | 37 | 29 | 1,036 | 36 | |
| 29 | Eswatini | 6 | 6 | 210 | 35 | |
| 30 | Malaysia | 14 | 13 | 440 | 34 | |
| 31 | St Lucia | 13 | 11 | 366 | 33 | |
| 32 | USA | 11 | 10 | 327 | 33 | |
| 33 | Gibraltar | 24 | 20 | 630 | 32 | |
| 34 | Kenya | 30 | 21 | 601 | 29 | |
| 35 | Brunei | 6 | 6 | 150 | 25 | |
| 36 | Cayman Islands | 19 | 16 | 344 | 22 | |
| 37 | Antigua & Barbuda | 24 | 16 | 322 | 20 | |
| 38 | Malta | 14 | 12 | 122 | 10 | |
| 39 | Papua New Guinea | 26 | 22 | 122 | 6 | |
| 40 | Israel | 10 | 10 | 55 | 6 | |
| 41 | Tanzania | 15 | 11 | 55 | 5 | |
| 42 | Hong Kong | 6 | 6 | 22 | 4 | |
| 43 | St Kitts & Nevis | 11 | 6 | 19 | 3 | |
| 44 | Lesotho | 6 | 3 | 0 | 0 | |
| 44 | St Maarten | 11 | 6 | 0 | 0 | |
| 44 | Switzerland | 14 | 12 | 0 | 0 |
